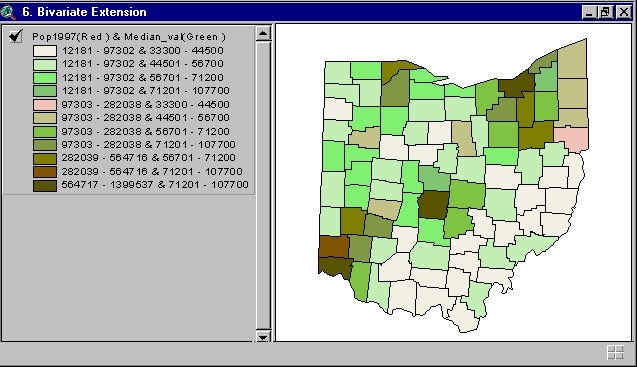
Bivarate choropleth are maps that display two variables on a single map by combining two different setes of graphic symbols or colors. This Bivariate shows the population in a state using different colours to indicatehow spacially or dence the population i in an area.
No comments:
Post a Comment