Monday, February 21, 2011

Triangular plot

http://www.techsoft.de/documents/graphxt.html
Triangular plot maps are used to display information into shape of triangle. This triangle shows the representation of the types of soil and its composition. triangular plot are used in the variables that has three presentation.

Wednesday, February 16, 2011

Digital Elveting Map

http://www.worldoxygenbank.com/Earth_Heights.htm
DEM maps are used to show elevetion of an area on earth.This DEM map shows the planet earth projection and the use of color to indicate sea level, high and low areas on earth.DEM are arrays of egular spaced elevation values referenced horizontally either to a universal Transverse Mercartor (UTM) projection or to a geographic coodinate system

Isobars map

http://www.uwlax.edu/faculty/skala/Air-Pressure.htm
This isobar map shows pressure in different places in U.S. Isobars shows a line on a weather map connecting points of equal atmospheric pressure.It is also used to define cyclones, low pressure regions and high pressure regins.weather map are desiged to depict the horizontal pressure distribution across an area of land.

Sunday, February 6, 2011

Star Plots

http://tshaffer2010.blogspot.com/2010_04_01_archive.html
       Star plots consists of sequence of equi-angle spokes called radii, with each spoken representing one of the variables. It is used to examine the relative values for a single data. Each star represent a single observation, which is generated in a multi-plotbformat with many stars on each page nd each star represent one observation.

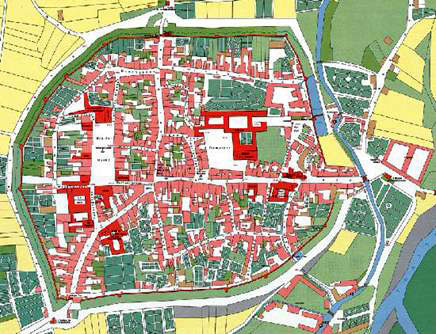
Cadastal Maps

http://www.spaceage.co.in/cadastral-surveys.php
Cadastal maps provides detailed information about real property within a specific area. a simple of a cadastal map might be a map of village which shows the boundaries of all of the parcels or lots within the village.This map  is maintained by governments and matter of public record.